2 of 3: Data Storytelling : Obvious to Some Analysis
Anjali Sharma
Director of Narrative
Published Date
November 20, 2020
If you have not read the introduction to this blog series, we recommend you read it here .
This blog is a part of 3 part blog series where we have learnt a sequence of analysis method used by radiologists and using that knowledge created a sequence of analysis method for data analysts.
In this blog post we cover how best to perform data storytelling and present your analysis when it is obvious to some only.
Obvious to Some Analysis
Multiple abnormalities need to be assessed, may not be obvious to people not trained in radiology like other specialties, but answer is definite to radiologist.
Example: A brain infection and cancer can look the same. But an experienced radiologist will be able to differentiate the abnormalities which are specific to a brain infection and cancer and also notice relevant things that are NOT present. For example, a brain cancer shows certain things and if they are not present, then it may point to an infection. And eventually, they put everything together to come up with a diagnosis which they are certain about.
Data Analysts Method: Multiple reasons that are not obvious as to why sales increased but analyst should be able to bring everything together and say why.Example:Let me explain this using an example of entrepreneur Ramakrishnan that I read in Effective Data Storytelling: How to drive change with data, narrative, and visuals by Brent Dykes.
Ramakrishnan mentions that a few years ago, he looked at transaction data from a large B2C retailer.One of the fields in the dataset was ‘transaction amount'.What did we expect to see? Well, we expected that most amounts would be around the average, but there will likely be some smaller amounts and some larger amounts. So a histogram of the field would probably look like this:
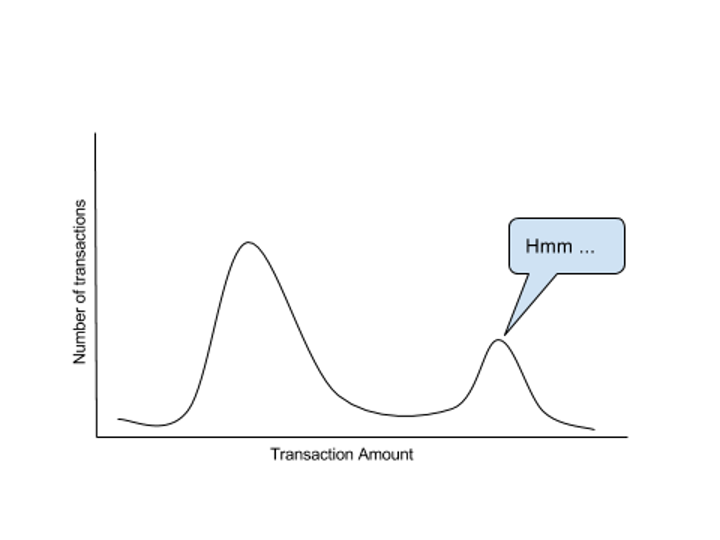
But when we checked the data, this is what we saw:
Ramakrishnan termed this unexpected bump ‚Äòhmm' and further shares that these transactions weren't made by their typical shopper — young moms shopping for their kids. They were made by people who would travel to the US from abroad once a year, walk into a store, buy lots of items, take them back to their country and sell them in their own stores. They were resellers who had no special relationship with our retailer. This retailer didn't have a physical presence outside North America at that time nor did they ship to those locations from their e-commerce site. But there was enough demand abroad that local entrepreneurs had sprung up to fill the gap. This modest "discovery" set off a chain reaction of interesting questions on what sorts of products these resellers were buying, what promotional campaigns may be best suited for them, and even how this data can be used to inform global expansion plans.
Now, only an experienced data analyst will be able to put the information in the graph, analyse the graph and investigate the hmm. Others, may just resort to rationalising the increase in sales to multiple reasons like promotions etc, with no clear insight that can lead to strategic direction for better business outcomes.
The data analyst adds value by investigating the minor subtle causes here and doesn't stop at just looking at the biggest and brightest cause.
You can read part 1 of 3 of this blog series here : Obvious to all
You can read part 3 of 3 this blog series here : Obvious to none
Sales professionals often apologise for taking up a customer’s time, especially when speaking to busy healthcare teams. While intended as empathy, this habit can undermine credibility and position the seller as an interruption rather than a partner.
This piece explores the difference between acknowledging busyness and apologising for it—and why confident, respectful storytelling builds stronger professional authority.
Empathy makes you sound kind. Resonance makes you sound credible. In this article, I unpack a real sales role-play to show why naming a problem isn’t enough — you must illuminate what’s at stake.