Data Storytelling: Why Do We Present Data Like A Maze?
Anjali Sharma
Director of Narrative
Published Date
November 22, 2017
As I am doing more and more work on Data Storytelling, I am coming across examples that are demonstrative of the fact that our ability to data storytell is still at its embryonic stages. There are simple things that we agree with in theory but fail to apply.
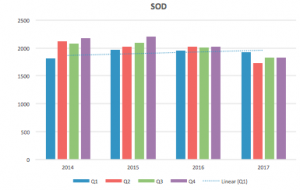
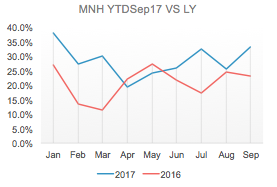
Here are some slides I have worked with that demonstrate my point.
Now, as soon your audience look at this, the feeling they get is very close to the feeling that one gets when they enter a maze without choice.
Confusion, Irritation, Frustration surfaces.
The first natural reaction of the audience is to stop listening to you because their brain starts to make meaning of what they are seeing. The problem is that these slides don't really guide you where to look. You are likely to lose interest in the presenter.
So What Should Change?
My learnings on change that we should seek to make in such an instance, come from Storytelling with Data by Cole Nussbaumer Knaflic.
A better way is to draw your audience's attention to where you want them to focus. You have to highlight the important stuff, but only the important stuff. Highlighting too much leads to diluting what you wanted to highlight in the first place. In Universal Principles of Design (Lidwell, Holden, and Butler, 2003), it is recommended that at most, 10% of the visual design be highlighted.
Here are some of the highlighting principles
Bold, Italics, and underlining: Use for titles, captions, labels and short word sentences to differentiate and highlight. Bolding is generally preferred over italics and underlining because it adds minimal noise to the design while clearly highlighting chosen elements. Italics also adds minimal noise, but also do not stand out as much. Underlining adds noise, so it should be used sparingly.
CASE Uppercase text in short word sequences is easily scanned, which can work well when applied to titles, labels and key
words. Avoid using different fonts as a highlighting technique, as it's difficult to attain a noticeable difference without disrupting aesthetics.
Color is an effective highlighting technique when used sparingly and generally in concert with other highlighting techniques (for example bold).
SIZE is another way to attract attention and signal importance.
As an example, look at the graph below. A graph similar to this was published by PEW Research Centre article titled, "New Census Data Show More Americans Are Tying the Knot, but Mostly it's the College Educated."
If you read the article that accompanied this graph, it is meant to demonstrate that the 2011 to 2012 increase observed in total new marriages was driven primarily by an increase in those having a bachelor's degree or more. The design above really doesn't draw your attention to that insight and makes you focus on the 2012 data because it is darker in color.
If we use the color as a strategy to draw attention, then the look of this graph could change like this
Now, where do your eyes go straight away? You have focussed the audience's attention to where you really want it to be.
Don't make your audience process everything to figure out where they should pay attention. Rather, direct their attention strategically to the most important part(s) of what you are showing. Create visual hierarchy by emphasising some elements and pushing others to the background.
Sales professionals often apologise for taking up a customer’s time, especially when speaking to busy healthcare teams. While intended as empathy, this habit can undermine credibility and position the seller as an interruption rather than a partner.
This piece explores the difference between acknowledging busyness and apologising for it—and why confident, respectful storytelling builds stronger professional authority.
Empathy makes you sound kind. Resonance makes you sound credible. In this article, I unpack a real sales role-play to show why naming a problem isn’t enough — you must illuminate what’s at stake.